Overview
The Energy Assurance Map shows the location and density of energy infrastructure in Santa Barbara County in relation to climate change risks and vulnerable populations. The map is part of an effort to adapt our local electricity system to one that provides clean, reliable, resilient, and community-powered energy for all of Santa Barbara County. This is called energy assurance.
The County of Santa Barbara has set goals for achieving energy assurance across the county, especially to benefit those most vulnerable to the impacts of climate change. The map is updated annually to allow County staff and stakeholders to see where energy assurance gaps exist and target resources to help close those gaps.
Below, we break down our energy system components in the Energy Assurance Map. These components (layers) can be turned on or off to explore various levels of detail in the interactive map. Click the links below to read highlights of the map’s key components (layers) related to the County’s Energy Assurance Goals.
Climate Change Risks
Wildfires and Flooding
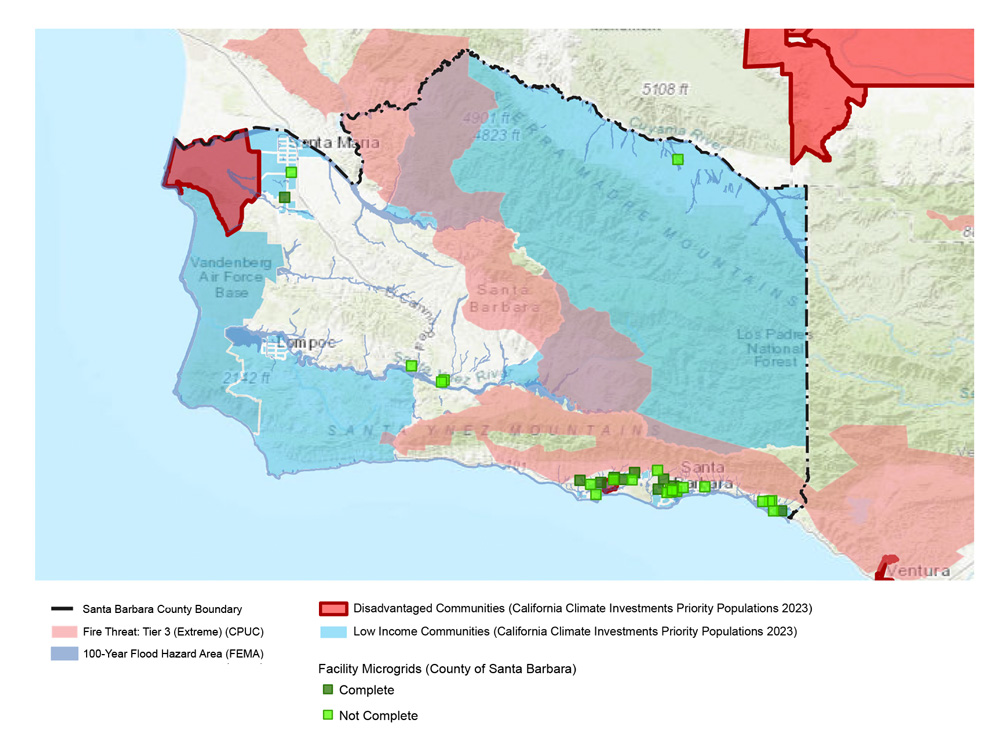
While cyclical wildfires and floods are endemic to Santa Barbara County, the frequency and scale of the disasters—and their potential to cause sustained utility outages—are increasing. The Energy Assurance Map includes these heightened fire and flooding risks—see Map 1 below. The California Public Utilities Commission’s Tier 3 (Extreme) fire risk areas are pink throughout the South Coast and mountains forming the eastern edge of the Santa Ynez and Santa Maria Valleys. The Federal Emergency Management Agency’s 100-year flood hazard areas are blue along the coastline and major waterways.
Energy Delivery Infrastructure
Power Lines and Substations
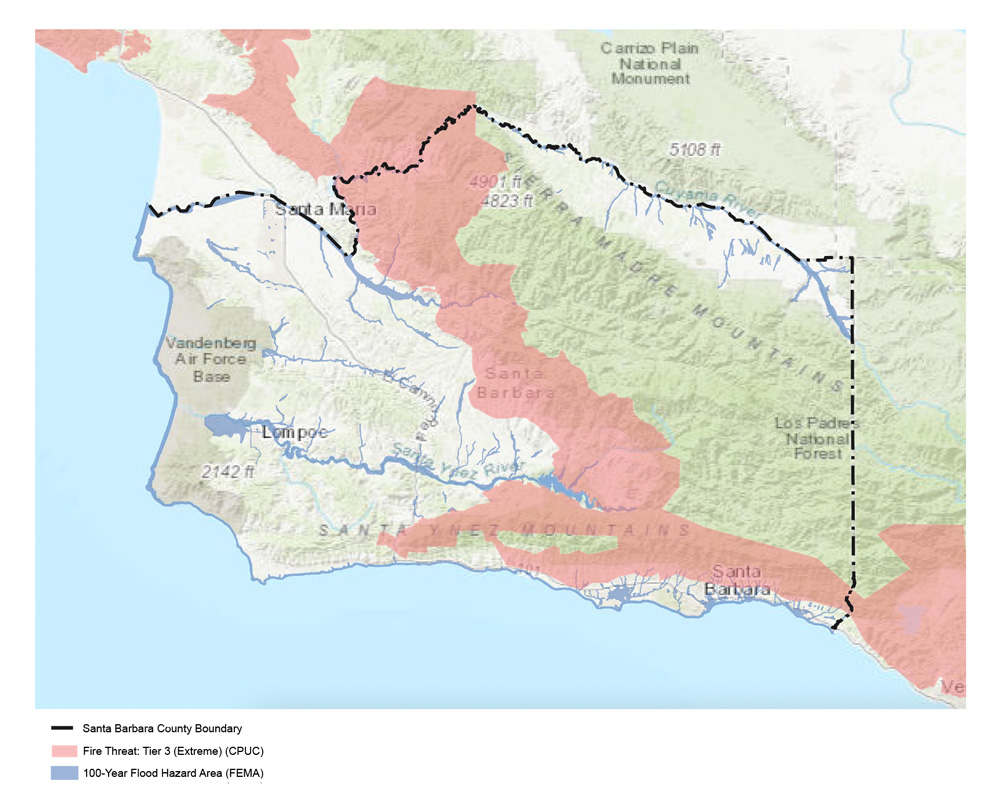
Two investor-owned utilities—Pacific Gas & Electric Company (PG&E, shown in light blue) and Southern California Edison (SCE, shown in dark green) — deliver electricity throughout Santa Barbara County. While county residents and businesses choose their electricity plan from a variety of entities, PG&E and SCE deliver the electricity to most Santa Barbara County customers over the power lines and electrical infrastructure that they own and operate.
Map 2 shows the location of PG&E’s and SCE’s transmission lines (shown in orange) that carry high-voltage electricity over longer distances, connecting utility-scale power plants with locations that consume large amounts of electricity like cities and industrial facilities. Substations (shown as light blue squares for PG&E and dark green squares for SCE) connect transmission lines with distribution lines, which carry lower-voltage electricity from substations to buildings, vehicle charging stations, etc. The electricity distribution lines, of which there are many more than transmission lines, are not shown on the map.
Some of these power lines and substations are located in high wildfire-risk areas, especially along the South Coast. When the utilities anticipate high winds and other conditions that may increase fire risk associated with their electricity delivery infrastructure, they may issue an alert for a Public Safety Power Shutoff (PSPS), where PG&E or SCE temporarily turn off power to reduce wildfire risk. This can avoid harm to people and the environment and may reduce longer-duration power outages if a fire were to spread. However, these PSPS events can introduce unintended consequences for the communities and critical facilities that are temporarily without power. The County of Santa Barbara Office of Emergency Management coordinates closely with PG&E, SCE, and others to prepare for and minimize these impacts. Residents can sign up for ReadySBC emergency alerts to be notified about power outages and other emergency events.
Utility Scale Energy Generation Infrastructure
Power Plants
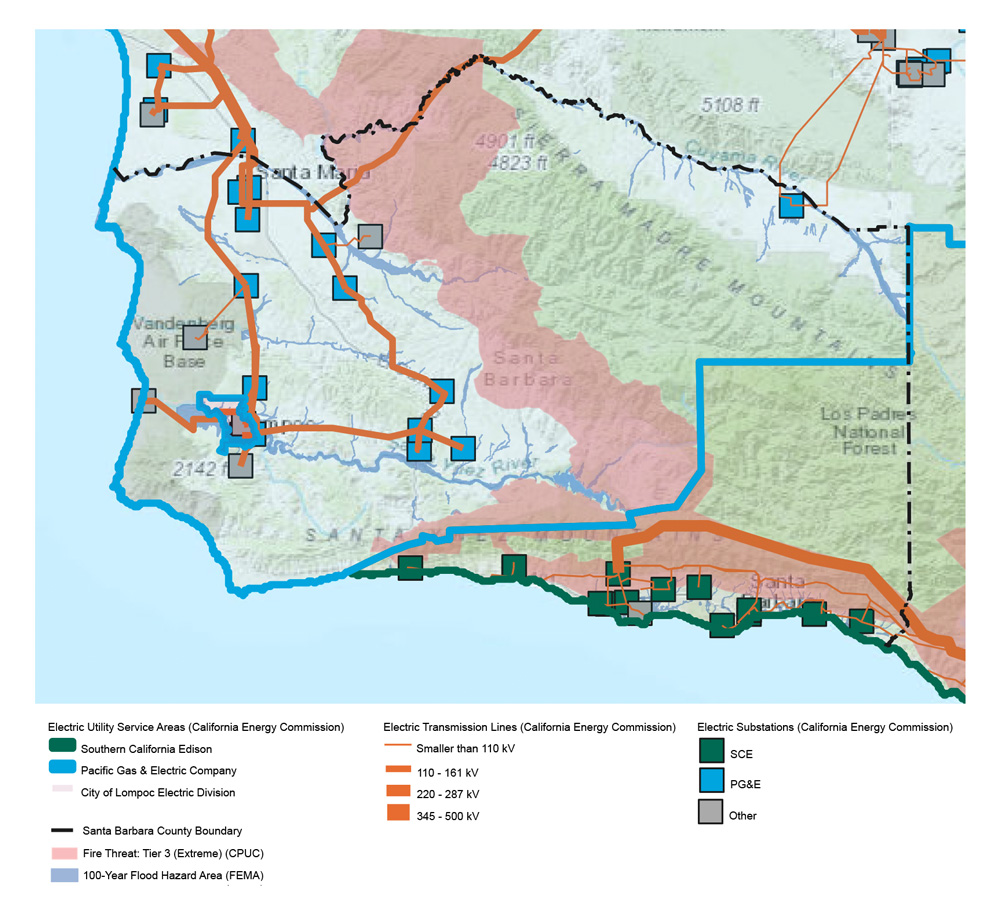
Historically we have relied on large centralized power plants to supply the electricity that powers our homes, businesses, and institutions. Most of these power plants are not located in Santa Barbara County, but there are a number of mid-sized power plants in the county. We expect the number of local renewable energy and centralized energy storage plants to increase in the next decade as the County develops ordinances that expand the availability of land suitable for power production and storage.
Map 3 shows the location of medium to large (utility-scale) power plants and energy storage systems throughout Santa Barbara County. There are 106 megawatts (MW) of utility-scale natural gas generation in the county. As of 2024, more than 190 MW of utility-scale renewable energy and more than 88 MW of utility-scale energy storage are operational or in development across the county.
Distributed Energy Infrastructure
Onsite Solar Energy + Battery Storage
We are transitioning to a more integrated energy system that also includes smaller (distributed) scale energy generation (like rooftop solar) and energy storage systems (like onsite batteries) installed at homes and businesses. At the start of 2024, more than 169 MW of distributed solar energy and 19 MW of distributed energy storage were installed across Santa Barbara County.
The County will continue to lead by example by investing in onsite solar energy and battery systems for County facilities. The County also supports residents and businesses in growing the number of distributed solar energy and energy storage systems that provide additional protection against power outages while meeting local and state renewable energy and climate goals.
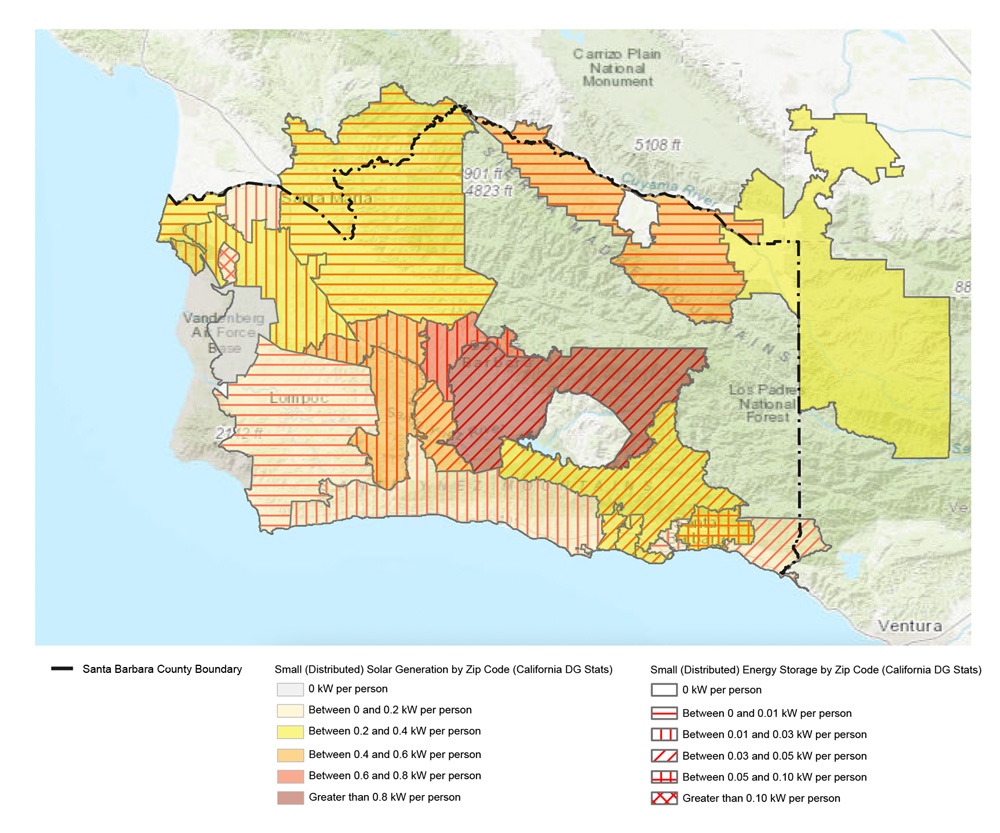
Map 4 shows the relative density of distributed solar energy and energy storage capacity in kilowatts (kW) per person by zip code. The map includes data from residential and non-residential onsite solar and energy storage systems that are reported by utilities and solar energy program administrators to the California Public Utilities Commission as part of the California Distributed Generation Statistics reporting program. Darker shading indicates a higher concentration of installed solar kW per person. The relative concentration of installed energy storage kW per person is shown by different types of crosshatching (see map legend).
Priority Populations
Low-Income and Disadvantaged Communities
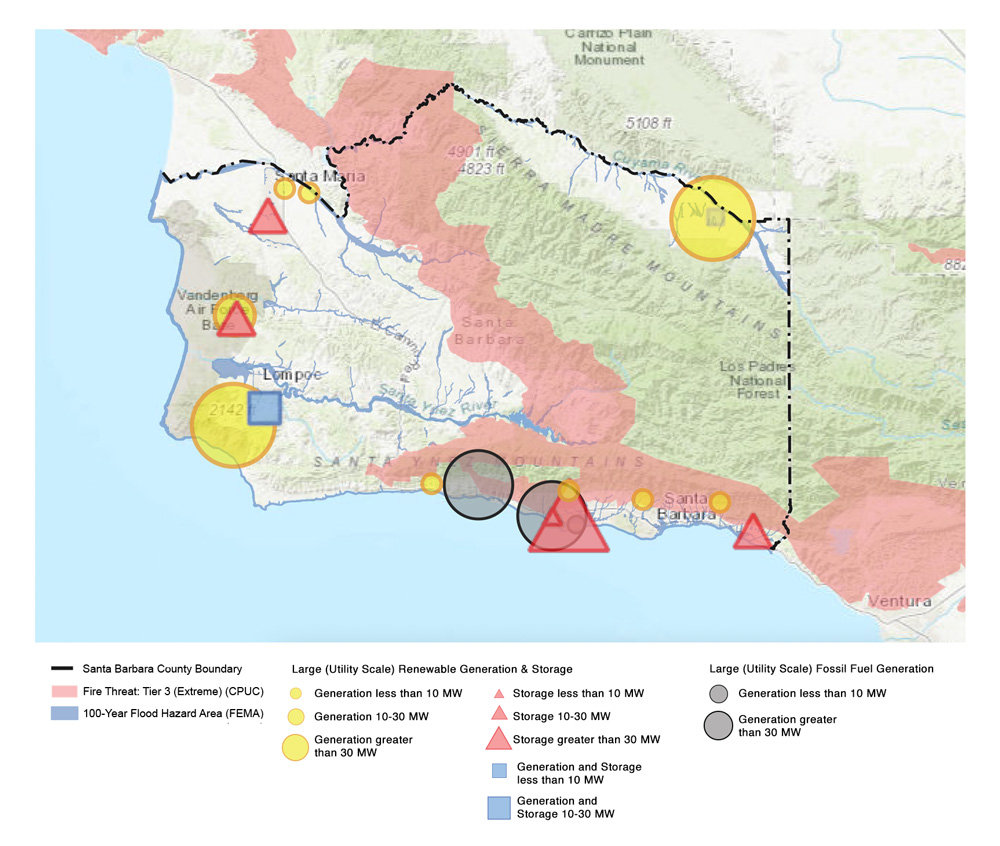
The County of Santa Barbara has set goals for achieving energy assurance across the county, especially to benefit those most vulnerable to the impacts of climate change. Mapping the location and density of renewable energy and energy storage systems will allow County staff and stakeholders to see where energy assurance gaps exist and target resources to help close those gaps for underresourced communities. Map 5 shows the Santa Barbara County census tracts with low-income (shown in light blue) and disadvantaged communities (shown in red) that are identified as California Climate Investments Priority Populations layered on top of high wildfire (shown in pink) and flooding (shown in blue) risk areas.
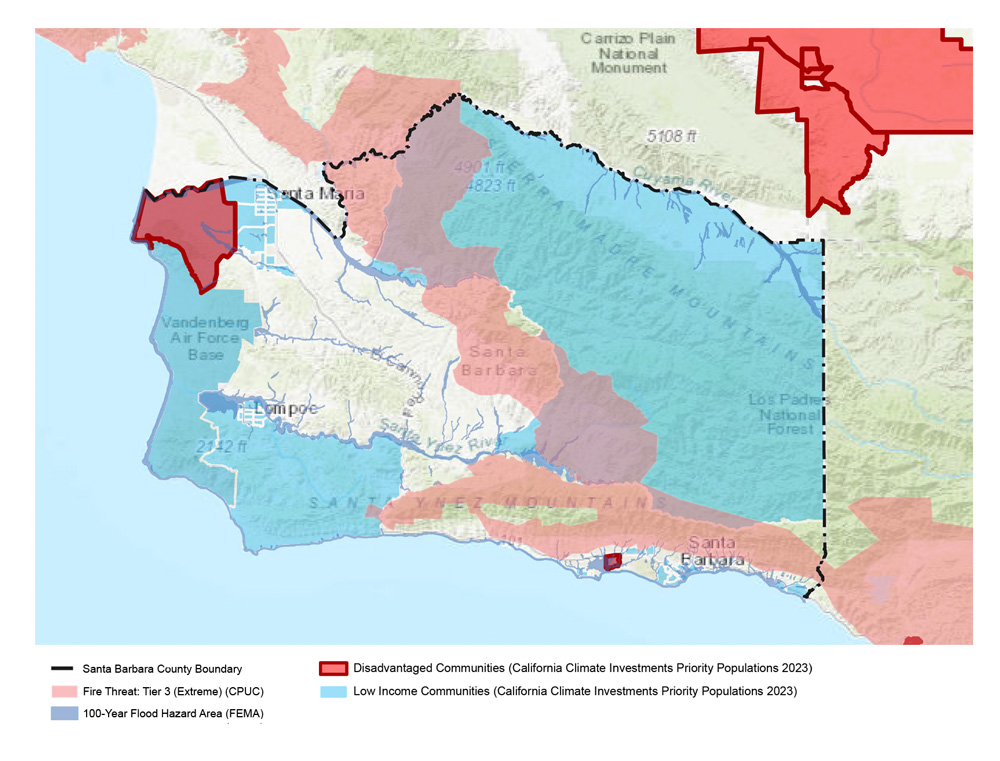
There is heightened flooding risk near priority populations in and around Guadalupe and Casmalia and Isla Vista and the Santa Barbara Airport. There is an elevated fire risk near priority populations east of Santa Maria. These may be areas for the County and other stakeholders to more heavily invest in energy assurance resources while working towards countywide education and distribution of renewable energy, energy storage, and demand response infrastructure and activities.
Microgrids
Controllable Solar + Storage
Wildfires, flooding, and other climate risks increase the potential for power outages and other detrimental impacts to county residents and businesses. One way to mitigate these risks is to increase the availability of backup power at critical facilities and other locations that serve priority populations who may not have the resources to invest in their own energy systems.
One backup power option is a microgrid. A microgrid is a self-sufficient energy system that serves a discrete geographic footprint, such as a school or government campus, hospital complex, business center, or neighborhood. A microgrid typically includes onsite energy generation, energy storage, and a control system so that the microgrid can operate independently from the electric grid. In Santa Barbara County, most of the current microgrid development is at the facility—rather than neighborhood or community—level.
Map 6 shows the location of known solar + battery microgrids at businesses, schools, governments, etc. across the county. These are shown with small green squares. Dark green squares indicate facilities with an operational microgrid. Light green squares indicate a microgrid is in planning or development. The Energy Assurance Map will be updated as new microgrids are added.
